
New research details the pandemic’s variable impact on U.S. school districts
Stanford and Harvard researchers have produced an unprecedented map of trends in learning loss, combining local and national test score data to reveal patterns that vary from one school district to the next.
Editor’s note: On May 11, 2023, the researchers released data for an additional 12 states that were unavailable when this story was published, as well as findings on the influence of additional community factors. The implications of the new findings were explored in an op-ed in the New York Times.
On the heels of new evidence of a nationwide decline in student achievement during the pandemic, a team of researchers at Stanford and Harvard released a detailed analysis today that brings the findings closer to home.

Research by Professor Sean Reardon of the Graduate School of Education and colleagues offers the first clear picture of pandemic learning loss at the school district level, revealing differences in the pandemic’s impact across U.S. communities. (Image credit: Holly Hernandez)
The Education Recovery Scorecard, published Oct. 28 by researchers at Stanford Graduate School of Education (GSE) and the Center for Education Policy and Research (CEPR) at Harvard, combines local and national test score data to map changes in student performance over the past three years within individual school districts.
Their analysis is the first clear picture of pandemic learning loss at the school district level, revealing differences in the pandemic’s impact across U.S. communities.
Test scores released earlier this week from the 2022 National Assessment of Educational Progress (NAEP) – widely known as the nation’s report card – showed, on average, a drop in math and reading scores between 2019 and 2022. But the analysis by Stanford and Harvard researchers shows how the losses varied from one school district to the next.
“In some school districts, students fell behind by as much as a grade level or more. In other school districts, the difference between the 2019 and 2022 test scores was essentially zero,” said Sean Reardon, the Professor in Poverty and Inequality at the GSE and a senior fellow at the Stanford Institute for Economic Policy Research, who led the data analysis behind the Education Recovery Scorecard. “There was enormous variability in the pandemic’s impact on kids’ academic performance.”
In addition to creating interactive maps detailing the variability among districts, the researchers identified patterns in the relationship between student performance and the extent of remote learning in each district, as well as trends among racial and economic groups.
The Education Recovery Scorecard also provides a forecast of the likely long-term implications for students and research on interventions that school districts could undertake to help students catch up.
“The pandemic was like a band of tornadoes that swept across the country. Some communities were left relatively untouched, while neighboring schools were devastated,” said Thomas J. Kane, a professor at Harvard Graduate School of Education and faculty director of CEPR, who co-led the analysis. “The Education Recovery Scorecard is the first high-resolution map of the tornadoes’ path, to help district leaders ascertain the magnitude of the damage and guide local recovery efforts.”
Identifying patterns and differences
The district-level analysis indicates that the pandemic exacerbated educational inequalities based on income, showing the most pronounced learning losses among students in low-income communities and school districts.
The analysis also showed that test scores declined more, on average, in school districts where students were learning remotely than where learning took place in person. But the extent to which a school district was in person or remote was a minor factor in the change in student performance, the researchers found.
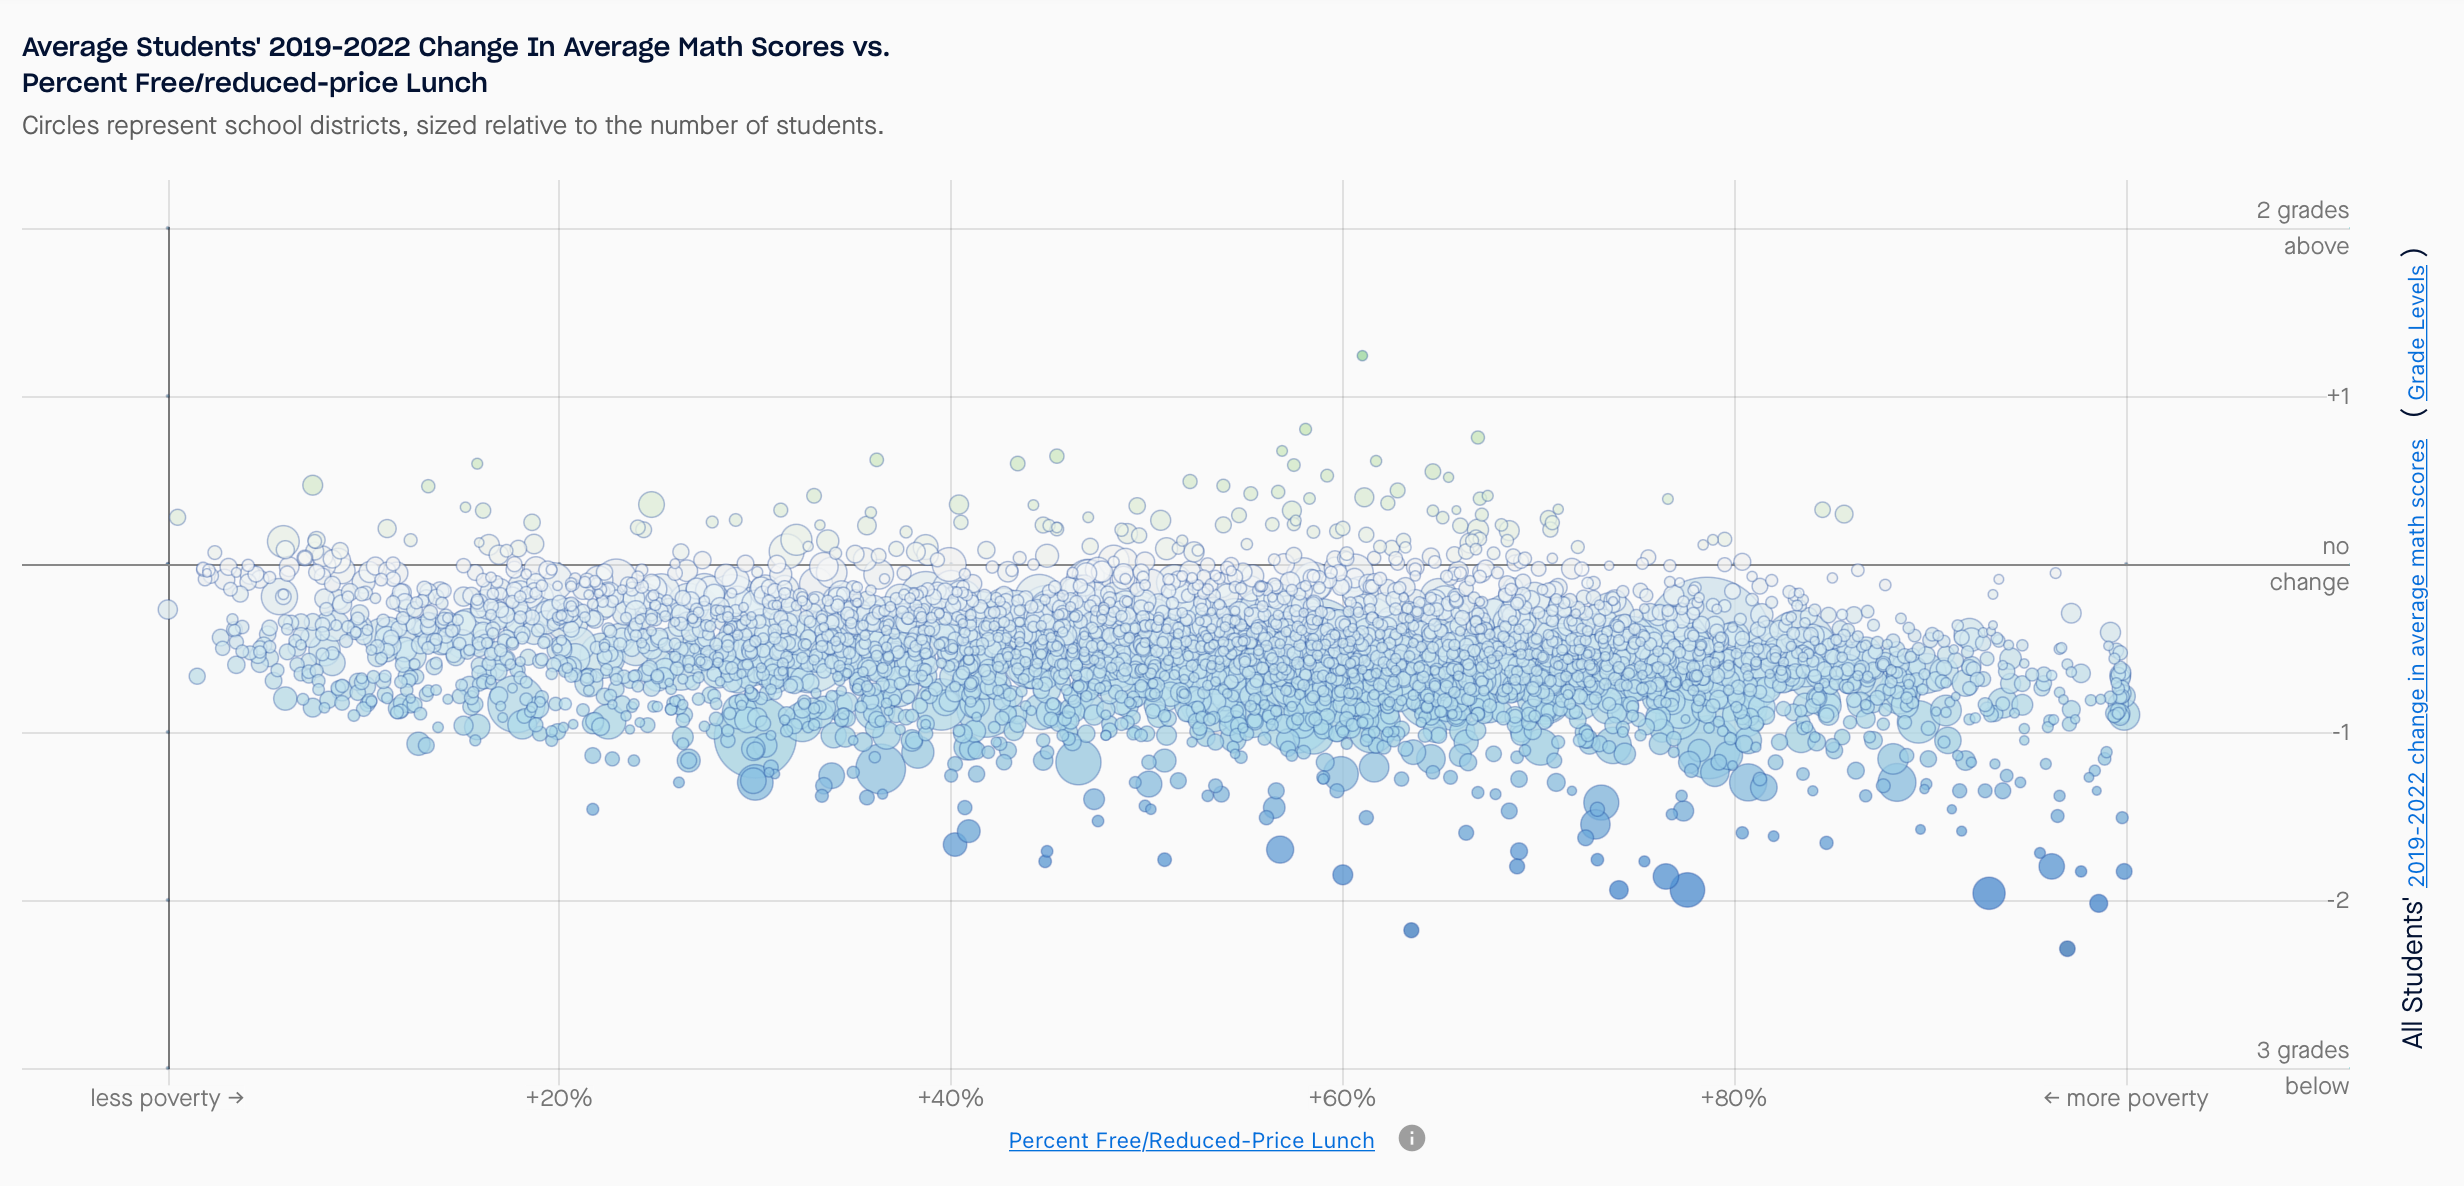
Learning losses were most pronounced among school districts in higher-poverty communities, using the percentage of students eligible for free/reduced-price lunch as a proxy for poverty levels. (Image credit: Courtesy Educational Opportunity Project)
“Even in school districts where students were in person for the whole year, test scores still declined substantially on average,” said Reardon, noting the toll that pandemic-related disruptions took on students’ routines, family and social support, and mental health. “A lot of things were happening that made it hard for kids to learn. One of them seems to be the extent to which schools were open or closed, but that’s only one among many factors that seems to have driven the patterns of change.”
The data analysis was conducted by the Educational Opportunity Project at Stanford University (EOP), an initiative launched by Reardon in 2019. The EOP houses the Stanford Education Data Archive (SEDA), a comprehensive national database of academic performance first made available online in 2016. Since then, researchers have used the massive data set, which contains standardized reading and math test scores from students in every public school in the nation, to study variations in educational opportunity by race, gender, and socioeconomic conditions.
To generate a district-level analysis of pandemic learning loss, Reardon’s team applied an approach they developed to produce estimates of student performance that are comparable across places, grades, and years – a challenge given the discrepancy between assessments used in different states from year to year.
In addition to administering the NAEP every two years, all states are required to test students in third through eighth grades each year in math and reading, and to make the aggregated results of those tests public. Because most states use their own annual test (and define “proficiency” in different ways), researchers generally can’t compare these yearly test results from one state directly with results from another.
Reardon’s team developed a research method to overcome that challenge: By aligning the annual statewide test results with scores from the biennial NAEP, his team produces data that can be compared across states. “We use state tests to measure district-level changes in academic skills, and the NAEP test serves as a kind of Rosetta stone that lets us put these changes on the same scale,” Reardon said. “Once we equate the tests from different states, we can make apples-to-apples comparisons among districts all over the country.”
Using demographic data also housed in SEDA, the researchers can estimate how scores within an individual district compare with statewide and national averages. They can also identify trends among various subgroups of students, including racial/ethnic and socioeconomic.
For the Education Recovery Scorecard, the research team obtained annual test scores from 30 states – all that have, to date, reported their districts’ proficiency rates for their spring 2022 assessments. The remaining states will be added to the analysis as their data becomes public.
Recalibrating targets for recovery funds
The Education Recovery Scorecard also reports how much money each school district has received through the Elementary and Secondary School Emergency Relief (ESSER) Fund, along with a summary of evidence on interventions that districts might implement, such as high-dose tutoring, summer school programs, extended school years, or even an optional 13th year of schooling.
The researchers hope the analysis will help policymakers and educators determine how best to direct pandemic relief funds and other efforts to support students who fell behind the most during the pandemic.
“Kids’ educational opportunities were really harmed in the past few years, and that damage was most pronounced in high-poverty communities,” Reardon said. “School districts are the first line of action to help children catch up. The better they know about the patterns of learning loss, the more they’re going to be able to target their resources effectively.”
Additional collaborators on this project include Erin Fahle, Andrew Ho, Ben Shear, Demetra Kalogrides, Jim Saliba, Julia Paris, Sadie Richardson, and Thalia Ramirez (Educational Opportunity Project); Tyler Patterson (Center for Education Policy Research); and Douglas Staiger (Dartmouth College). The Stanford Education Data Archive (SEDA) and the Education Recovery Scorecard are based on research funded in part by the Bill & Melinda Gates Foundation and the Carnegie Corporation of New York. Some of the data used in constructing the SEDA files were provided by the National Center for Education Statistics.